
Common words
This visualization shows which words are used most often in different programming languages.
The index was built between mid/end of 2016 from ~3 million public open source
GitHub repositories. Results are presented as word clouds and text:
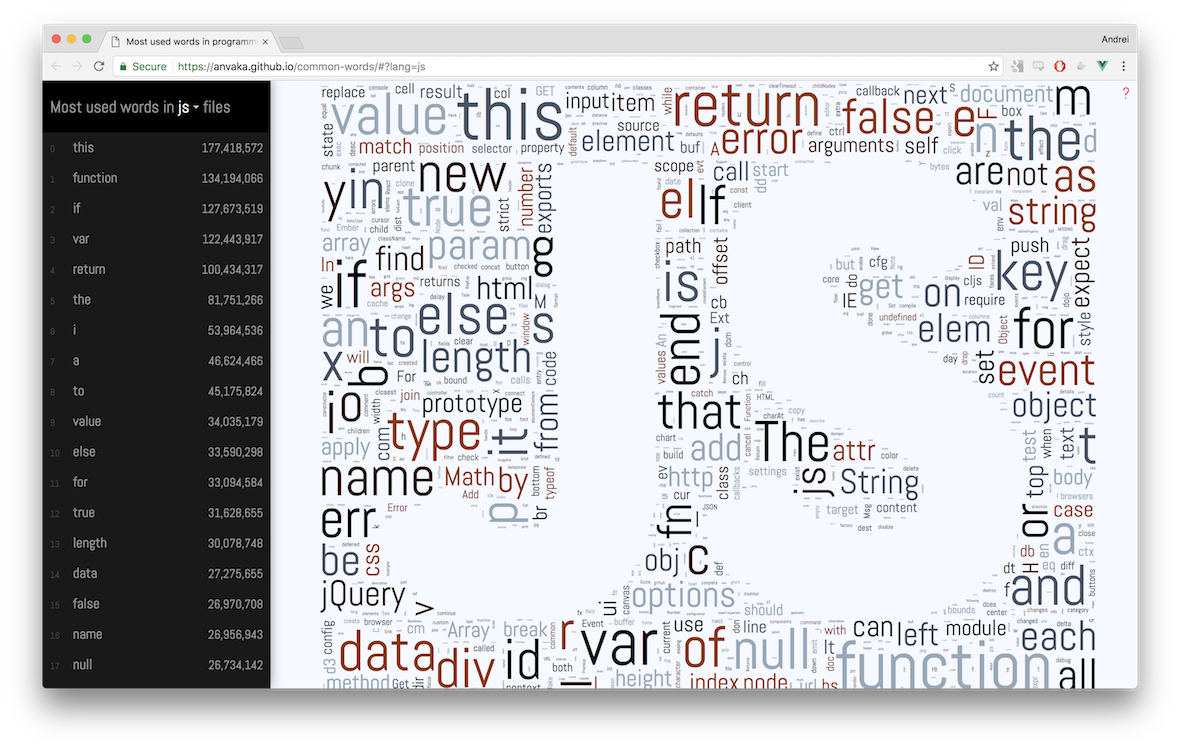
Below is description of hows and whys. If you want to explore visualizations - please click here: common words.
Tidbits
-
I store the most common words from many different programming languages as part of this repository. GitHub's language recognition treats this repository as mostly C++. It makes sense because many of those languages were inspired by C/C++:

-
License text is commonly put into comments in every programming language. Of all languages Java code was the winner with
127words out of966coming from license text: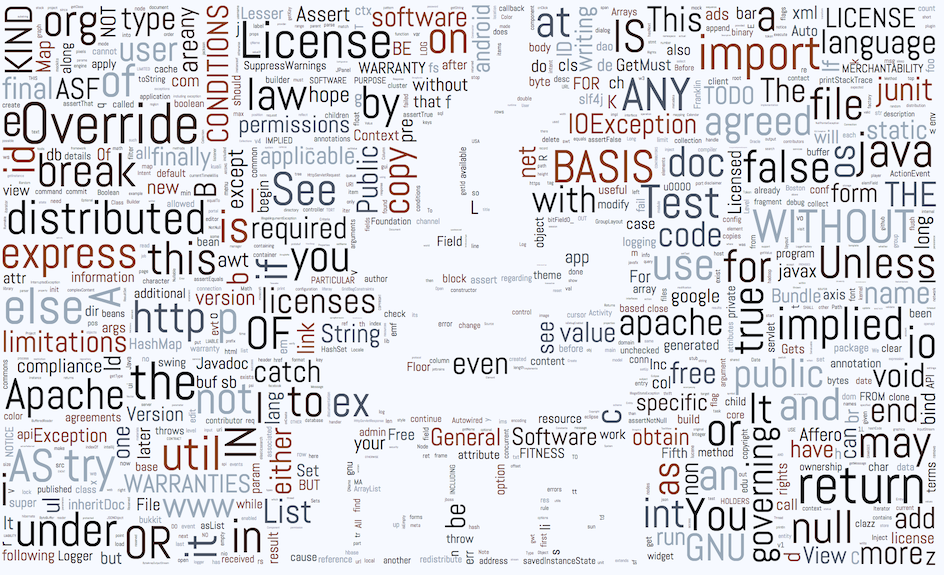
- In fact it was so overwhelming that I decided to filter out license text.
-
Luais the only programming language that has a swear word in top 1,000. Can you find it? -
In
Goerris as popular asreturn. Here is why.
If you find more interesting discoveries - please let me know. I'd be happy to include them here.
How?
I extracted individual words from the github_repos data set using BigQuery. A word is extracted along with the top 10 lines of code where this word appeared.
I apply several constraints before saving individual words:
- The line where this word appears should be shorter than 120 characters. This helps me filter out code not written by a human, like minified JavaScript.
- I ignore punctuation (
, ; : .), operators (+ - * ...) andnumbers. So if the line isa+b + 42, then only two words are extracted:aandb. - I ignore lines with "license markers" - words that predominantly appear inside license text
(e.g.
license,noninfringement, etc.). License text is very common in code. It was interesting to see at the beginning, but overwhelming at the end, so I filtered it out. - Words are case sensitive:
Thisandthiswill be counted as two separate words.
How was the data collected?
In this section we take deeper look into words extraction. If you are not interested jump to word clouds algorithm.
Data comes from the GitHub's public data set, indexed by BigQuery: github_repos
BigQuery stores the contents of each indexed file in a table as plain text:
| File Id | Content |
|---|---|
| File 1.h | // File 1 content\n#ifndef FOO\n#define FOO... |
| File 2.h | // File 2 content\n#ifndef BAR\n#define BAR... |
To build a word cloud we need a weight to scale each word accordingly.
To get the weight we could split text into individual words, and then group table by each word:
| Word | Count |
|---|---|
| File | 2 |
| content | 2 |
| ... | ... |
Unfortunately, this naive approach does exactly what people don't like about word clouds - each word will be taken out of context.
I wanted to avoid this problem, and allow people to explore each word along with their contexts:
To achieve this, I created a temporary table (code), that instead of counting individual words counts lines:
| Line | Count |
|---|---|
| // File 1 content | 1 |
| #ifndef FOO | 1 |
| #define FOO | 1 |
| ... | ... |
This gave me "contexts" for each word and reduced overall data size from couple terabytes
to ~12GB.
To get top words from this table we can employ the previously mentioned technique of splitting line content into individual words, and then group the table by each word. We can also get a word's context if we keep the original line in an intermediate table:
| Line | Word |
|---|---|
| // File 1 content | File |
| // File 1 content | content |
| #ifndef FOO | ifndef |
| #ifndef FOO | FOO |
| ... | ... |
From this intermediate representation we can use SQL window function to group by word and get top 10 lines for each word (more info here: Select top 10 records for each category)
Current extraction code can be found here: extract_words.sql
Note 1: My SQL-fu is in kindergarten, so please let me know if you find an error or maybe more appropriate way to get the data. While the current script is working, I think there may be cases where results are slightly skewed.
Note 2: BigQuery is amazing. It is powerful, flexible, and fast. Huge kudos to the amazing people who work on it.
How are word clouds rendered?
At the heart of word clouds lies very simple algorithm:
for each word `w`:
  repeat:
    place word `w` at random point (x, y)
  until `w` does not intersect any other word
To prevent the inner loop from running indefinitely we can try only limited number of times and/or reduce word's font size if it doesn't fit.
If we step back a little bit from the words, we can formulate this problem in terms of rectangles: For each rectangle try to place it onto a canvas, until it doesn't intersect any other pixel.
Obviously, when canvas is heavily occupied finding a spot for a new rectangle can become challenging or not even possible.
Various implementations tried to speed up this algorithm by indexing occupied space:
- Use summed area table to quickly, in O(1) time, tell if a new candidate rectangle intersects anything under it. The downside of this method is that each canvas update requires updating the entire table, which gives bad performance;
- Maintain some sort of
R-treeto quickly tell if a new candidate rectangle intersects anything under it. Intersection lookup in this approach is slower than in summed area tables, but index maintenance is faster.
I think the main downside of both of these methods is that we still can get wrong initial point many number of times before we find a spot that fits new rectangle.
I wanted to try something different. I wanted to build an index that would let me quickly pick a rectangle large enough to fit my new incoming rectangles. Make index of the free space, not occupied one.
I choose a quadtree to be my index.
Each non-leaf node in the tree contains information about how many free pixels
are available underneath. At the very basic level this can immediately answer
question: "Is there enough space to fit M pixels?". If a quad has less available
pixels than M, then there is no need to look inside.
Take a look at this quad tree for JavaScript logo:

Empty white rectangles are quads with available space. If our candidate rectangle is smaller than any of these empty quads we could immediately place it inside such quad.
A simple approach with quadtree index gives decent results, however, it is also susceptible to visual artifacts. You can see quadrants borders - no text can be placed on the intersection of quads:
The largest quad approach can also miss opportunities. What if there is no single
quad large enough to fit a new rectangle, but, if united with neighboring quads
a fit can be found?
Indeed, uniting quads helps to find spots for new words, as well as removes visual artifacts. Many quads are united, and the text is likely to appear on intersection of two quads:
My final code for quadtree word cloud generation is not released. I don't think it is ready to be reused anywhere else.
How was the website created?
Rendering text
Overall I was happy with achieved
speed of word cloud generation. Yet, it was still too slow for common-words website.
I'm using SVG to render each word on a screen. Rendering alone so many text elements can halt the UI thread for a couple seconds. There is just not enough CPU time to squeeze in text layout computation. The good news - we don't have to.
Instead of computing layout of words over and over again every time when you open a page, I decided to compute layout once, and store results into a JSON file. This helped me to focus on UI thread optimization.
To prevent UI blocking for long periods of time, we need to add words asynchronously.
Within one event loop cycle we add N words, and let browser handle user commands
and updates. On the second loop cycle we add more, and so on. For these purposes
I made anvaka/rafor, which is an asynchronous for loop
iterator that adapts and distributes CPU load across multiple event loop cycles.
Pan and zoom
The website supports Google-maps like navigation on SVG scene. It is also mobile and keyboard friendly. All these feature are implemented by panzoom library.
Application structure
I'm using vue.js as my rendering framework. Mostly because it's very simple and fast. Single file components and hot reload make it fast to develop in.
The entire application state is stored in a single object and individual language files are loaded when user selects corresponding element from a drop down.
As my message dispatcher I'm using ngraph.events, a very small message passing library with focus on speed.
I use anvaka/query-state to store currently selected language in the query string.
Tools summary
- https://github.com/anvaka/query-state - allow storing application state in
the query string. Supports bidirectional updates:
query string <-> application state - https://github.com/anvaka/rafor - asynchronous iteration over array, without blocking the UI thread. This module adapts to amount of work per cycle, so that there is enough CPU time to keep UI responsive.
- https://github.com/anvaka/simplesvg - very simple wrapper on top of SVG DOM elements, providing easy manipulation.
- https://github.com/anvaka/panzoom - a library that allows Google-maps-like panning and zooming of an SVG scene.
Why word clouds?
Word clouds in general are considered bad for several reasons:
- They take words out of their context. So
gooddoes not necessary mean something is good (e.g. when wordnotwas dropped from visualization) - They scale words to fit inside a picture. So the size of a word cannot be trusted
- They drop some common words (like
a,the,not, etc.)
However, I was always fascinated by algorithms that fit words inside a given shape to produce word cloud.
I spent last couple months of my spare time developing my own word cloud algorithm. And this website was born. It was fun :).
Thank you!
Thank you, dear reader, for being curious. I hope you enjoyed this small exploration. Also special thanks to my co-worker, Ryan, who showed me word clouds in the first place. And to my lovely wife who inspires me and encourages me in all my pursuits.
PS
I also tried to bring word clouds into "real life" and created several printed products (T-Shirts, hoodies and mugs). However I didn't like T-Shirts very much, so I'm not going to show them here.
The javascript mug - I think is my best real world word cloud:
Feel free to buy it if you love javascript. I hope you enjoy it!