What?
This is a general purpose lightweight backtesting engine for stocks, written in Java.
Some advantages compared to other backtesting implementations are:
- It uses a callback model and since it is implemented in java it should be pretty performant when running many backtests
- Easily extensible
- Strategies are easily debuggable using a Java IDE
- Lightweight and therefore the backtesting engine is easily verifiable
- Backtesting results are further analyzable in R or Excel since it uses a CSV output format
Cointegration/Pairs trading
I've written this library primarily to try out this particular strategy.
The cointegration strategy, or also known as pairs trading strategy, tries to take two stocks and create a linear model to find a optimal hedge ratio between them in order create a stationary process.
Assume stocks A and B with prices Pa and Pb respectively, we set Pa = alpha + beta*Pb and try to find optimal alpha and beta.
One method to find alpha and beta is using a so called Kalman Filter which is a dynamic bayesian model and we use it as an online linear regression model to get our values.
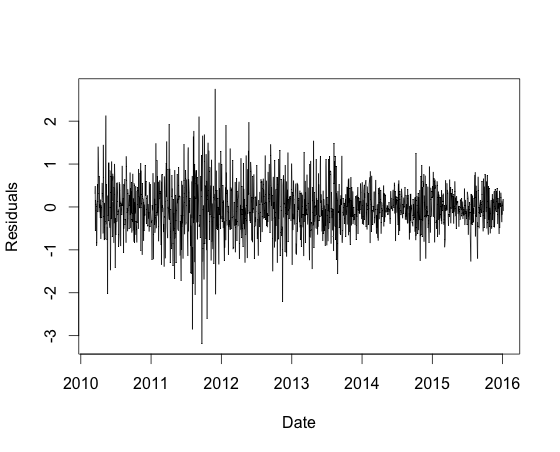
After we've found the values we look at the residuals given by residuals = Pa - alpha - beta*Pb,
and if the last residual is greater than some threshold value you go short n A stocks and long n*beta B stocks, for some fixed n.
For further explanation and a formal definition of cointegration and the strategy you may want to look at:
- https://www.quantopian.com/posts/how-to-build-a-pairs-trading-strategy-on-quantopian or
- Ernie Chan's book Algorithmic Trading: Winning Strategies and Their Rationale
A good introduction video series to the Kalman filter can be found at Udacity (https://www.udacity.com/wiki/cs373/unit-2).
How?
Running a backtest
Run a backtest skeleton:
void doBacktest() {
        String x = "GLD";
        String y = "GDX";

        // initialize the trading strategy
        TradingStrategy strategy = new CointegrationTradingStrategy(x, y);

        // download historical prices
        YahooFinance finance = new YahooFinance();
        MultipleDoubleSeries priceSeries = new MultipleDoubleSeries(finance.getHistoricalAdjustedPrices(x).toBlocking().first(), finance.getHistoricalAdjustedPrices(y).toBlocking().first());

        // initialize the backtesting engine
        int deposit = 15000;
        Backtest backtest = new Backtest(deposit, priceSeries);
        backtest.setLeverage(4);

        // run the backtest
        Backtest.Result result = backtest.run(strategy);

        // show results
        System.out.println(format(Locale.US, "P/L = %.2f, Final value = %.2f, Result = %.2f%%, Annualized = %.2f%%, Sharpe (rf=0%%) = %.2f", result.getPl(), result.getFinalValue(), result.getReturn() * 100, result.getReturn() / (days / 251.) * 100, result.getSharpe()));
}
Creating a new strategy
Just create a class which implements org.lst.trading.lib.model.TradingStrategy, for example a simple buy and hold strategy might look like this:
public class BuyAndHold implements TradingStrategy {
    Map<String, Order> mOrders;
    TradingContext mContext;

    @Override public void onStart(TradingContext context) {
        mContext = context;
    }

    @Override public void onTick() {
        if (mOrders == null) {
            mOrders = new HashMap<>();
            mContext.getInstruments().stream().forEach(instrument -> mOrders.put(instrument, mContext.order(instrument, true, 1)));
        }
    }
}
The onTick() method is called for every price change, all relevant information (like historical prices, etc..) is available through
TradingContext and also orders can be submitted through it.
Interesting classes to look at
- Backtest: The core class which runs the backtest
- package
org.lst.trading.lib.series: - TimeSeries: A general purpose generic time series data structure implementation and which handles stuff like mapping, merging and filtering.
- DoubleSeries: A time series class which has doubles as values. (corresponds to a pandas.Series (python))
- MultipleDoubleSeries: A time series class which has multiple doubles as values. (corresponds to a pandas.DataFrame or a R Dataframe)
- KalmanFilter: A general purpose and fast Kalman filter implementation.
- Cointegration: A cointegration model using a Kalman filter.
- CointegrationTradingStrategy: The cointegration strategy implementation.
Example run of the cointegration strategy
To run a backtest, edit and then run the main class org.lst.trading.main.BacktestMain.
By default the cointegration strategy is executed with the GLD vs. GDX ETF's and you might get a result like this:
$ ./gradlew run
19:35:28.327 [RxCachedThreadScheduler-1] DEBUG org.lst.trading.lib.util.Http - GET http://ichart.yahoo.com/table.csv?s=GLD&a=0&b=1&c=2010&d=0&e=6&f=2016&g=d&ignore=.csv
19:35:29.655 [RxCachedThreadScheduler-1] DEBUG org.lst.trading.lib.util.Http - GET http://ichart.yahoo.com/table.csv?s=GDX&a=0&b=1&c=2010&d=0&e=6&f=2016&g=d&ignore=.csv

1,364,Buy,GDX,2010-02-23T00:00:00Z,2010-02-25T00:00:00Z,40.658018,41.566845,330.813028
...
577,1081,Sell,GDX,2015-12-23T00:00:00Z,2015-12-28T00:00:00Z,13.970000,13.790000,194.580000
578,145,Buy,GLD,2015-12-23T00:00:00Z,2015-12-28T00:00:00Z,102.309998,102.269997,-5.800145

Backtest result of class org.lst.trading.main.strategy.kalman.CointegrationTradingStrategy: CointegrationStrategy{mY='GDX', mX='GLD'}
Prices: MultipleDoubleSeries{mNames={GLD, GDX, from=2010-01-04T00:00:00Z, to=2016-01-05T00:00:00Z, size=1512}
Simulated 1512 days, Initial deposit 15000, Leverage 4.000000
Commissions = 2938.190000
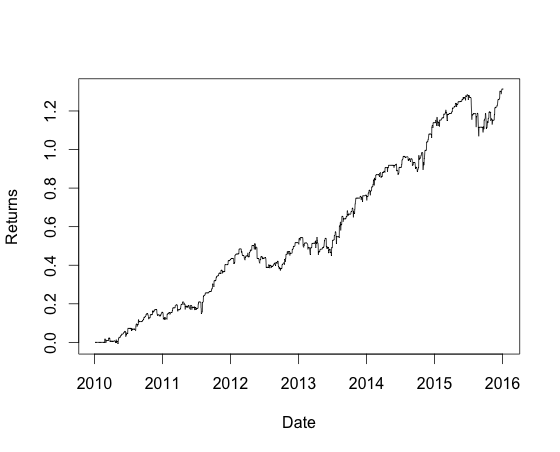
P/L = 22644.75, Final value = 37644.75, Result = 150.97%, Annualized = 25.06%, Sharpe (rf=0%) = 1.37

Orders: /var/folders/_5/jv4ptlps2ydb4_ptyj_l2y100000gn/T/out-7373128809679149089.csv
Statistics: /var/folders/_5/jv4ptlps2ydb4_ptyj_l2y100000gn/T/out-1984107031930922019.csv
To further investigate the results you can import the CSV files into some data analysis tool like R or Excel.
I've created a R script which does some rudimentary analysis (in src/main/r/report.r).
The return curve of the above strategy plotted using R:
This is a plot of the implied residuals:
The cointegration can be quite profitable however the difficulty is to find some good cointegrated pairs.
You might want to try for example Coca-Cola (KO) and Pepsi (PEP), gold (GLD) and gold miners (GDX) or Austrialia stock index (EWA) and Canada stock index (EWC) (both Canada and Australia are commodity based economies).
Why?
I'm generally interested in algorithmic trading and I read about the cointegration trading strategy in Ernest Chans Book and wanted to try it out. I know many people prefer using tools like Matlab and R to try out their strategies, and I also agree with them you can't get a prototype running faster using these technologies, however after the prototyping phase I prefer to implement my strategies in a "full blown" programming language where I have a mature IDE, good debugging tools and less 'magic' where I know exactly what is going on under the hood.
This is a side project and I'm not planning to extend this further.
It is thought as a educational project, if you want to do something similar, this may be a good starting point or if you just want to try out different strategies. I thought it might be useful for someone so I decided to make this open source. Feel free to do anything what you want with the code.
Who?
My name is Lukas Steinbrecher, I'm interested in financial markets, (algorithmic) trading, computer science and also bayesian statistics (especially MCMC methods).
If you have any questions or comments feel free to contact me via [email protected] or on lukstei.com.
License
MIT

