• Stars
    star
    1,081
  • Rank 42,808 (Top 0.9 %)
  • Language
    Python
  • License
    MIT License
  • Created over 8 years ago
  • Updated over 1 year ago

Reviews

There are no reviews yet. Be the first to send feedback to the community and the maintainers!

Repository Details

High-level geospatial data visualization library for Python.

geoplot: geospatial data visualization
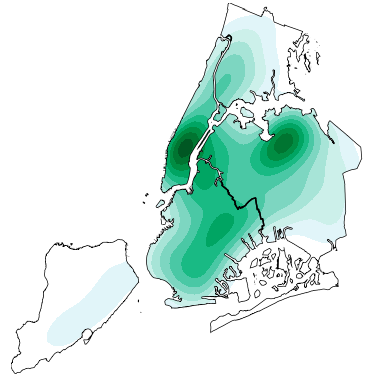
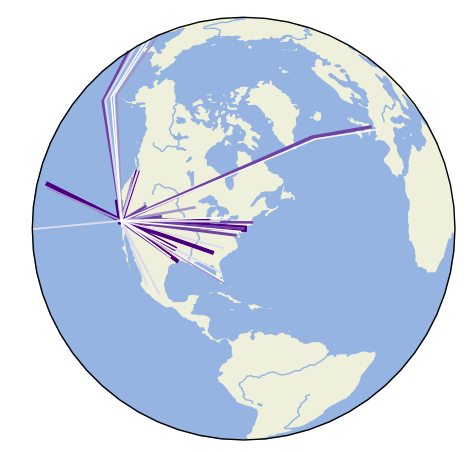
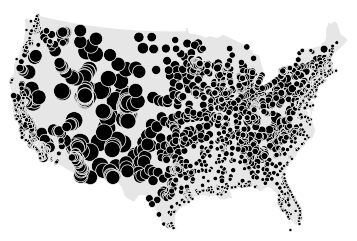
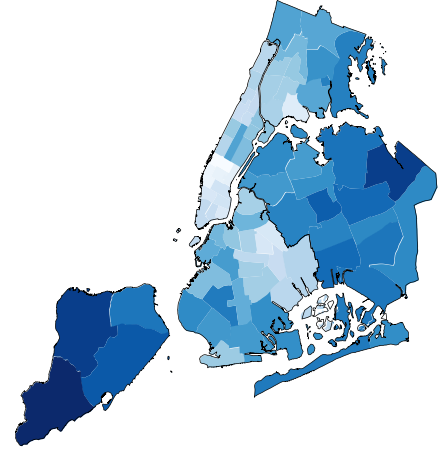
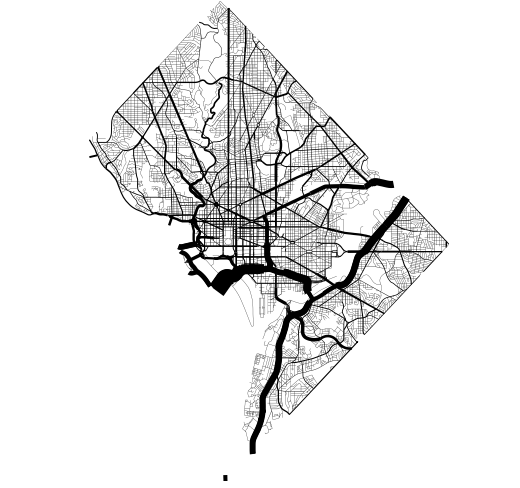
geoplot is a high-level Python geospatial plotting library. It's an extension to cartopy and matplotlib which makes mapping easy: like seaborn for geospatial. It comes with the following features:

  • High-level plotting API: geoplot is cartographic plotting for the 90% of use cases. All of the standard-bearermaps that you’ve probably seen in your geography textbook are easily accessible.
  • Native projection support: The most fundamental peculiarity of geospatial plotting is projection: how do you unroll a sphere onto a flat surface (a map) in an accurate way? The answer depends on what you’re trying to depict. geoplot provides these options.
  • Compatibility with matplotlib: While matplotlib is not a good fit for working with geospatial data directly, it’s a format that’s well-incorporated by other tools.

Installation is simple with conda install geoplot -c conda-forge. See the documentation for help getting started.


Author note: geoplot is currently in a maintenence state. I will continue to provide bugfixes and investigate user-reported issues on a best-effort basis, but do not expect to see any new library features anytime soon.

More Repositories

1

missingno

Missing data visualization module for Python.
Python
3,634
star
2

py_d3

D3 block magic for Jupyter notebook.
Python
452
star
3

designing-data-intensive-applications-notes

Reading notes on the excellent "Designing Data-Intensive Applications"
Jupyter Notebook
196
star
4

boston-airbnb-geo

A Deep Dive into Geospatial Analysis in Python (Tutorial)
Jupyter Notebook
54
star
5

gtfs-tripify

Turn GTFS-RT transit updates into historical arrival data.
Python
41
star
6

wargame-data

An export of unit values from the strategic real-time strategy game Wargame: Red Dragon.
Jupyter Notebook
27
star
7

watsongraph

Concept discovery and recommendation library built on top of the IBM Watson cognitive API.
Python
24
star
8

progressive-resizing

Applying progressive resizing to building models in Keras.
Jupyter Notebook
18
star
9

checkpoints

Partial result caching for pandas in Python.
Python
16
star
10

hurdat2

Process files and docs for the standardization of NOAA HURDAT2 database.
Jupyter Notebook
14
star
11

geoplot-data

Raw data files used by the geoplot examples and documentation
11
star
12

advanced-pandas-exercises

https://www.kaggle.com/residentmario/advanced-pandas-exercises
Python
9
star
13

streetmapper

Geospatial tools for working with census blocks, street networks, building footprints in Python
Python
8
star
14

citibike

Data processing for a CitiBike trip data visualization.
Jupyter Notebook
8
star
15

socrata-portal-metadata

Python module for exploring Open Data Portal metadata.
Jupyter Notebook
8
star
16

data-science-team

Presentation materials from the prospective CUNY Baruch Data Science Competition Team.
HTML
7
star
17

wargame

A LaTeX guide to unit values in the strategic RTS game "Wargame: Red Dragon".
TeX
6
star
18

signpostviews

A Jupyter notebook and some associated files studying Signpost article viewership.
Jupyter Notebook
5
star
19

acris

Overview of the New York City Department of Finance's ACRIS dataset(s).
Jupyter Notebook
5
star
20

yellowbrick-x-keras

How to use the yellowbrick metrics dataviz library with keras
Jupyter Notebook
4
star
21

airscooter

Command-line utility for simple graph-based data workflows.
Python
4
star
22

python-missing-data

NOW A BLOG POST: http://www.residentmar.io/2016/06/12/null-and-missing-data-python.html
Jupyter Notebook
4
star
23

dt-guide

LaTeX guide written to accompany Dwarf Therapist.
TeX
4
star
24

motor-vehicle-collisions

Using NYPD Motor Vehicle Collisions data from the NYC Open Data portal to study traffic accidents in New York City.
Jupyter Notebook
4
star
25

chain-incidence

Data munging for the subject of http://www.residentmar.io/2016/02/09/average-chain-distance.html and http://gothamist.com/2016/02/09/starbucks_ubiquitous.php
HTML
3
star
26

co_reader

A module for retrieving recent NYC DOB certificate of occupancy issuance dates.
Python
3
star
27

pytorch-training-performance-guide

Guidebook and reference on PyTorch training optimizations
TeX
3
star
28

subway-explorer-api

API for ground-truth MTA subway arrival and departure times.
JavaScript
3
star
29

nyc-building-values

Jupyter Notebook
3
star
30

mta-data-exploration-old

Dev materials for what became the gtfs-tripify module
Jupyter Notebook
3
star
31

go-bike-sankey

http://www.residentmar.io/2019/01/15/ford-go-bike-maps.html
Jupyter Notebook
3
star
32

fahr

Run remote machine learning model training jobs right from the command line.
Python
3
star
33

machine-learning-notes

A microsite hosting my machine learning notes.
HTML
2
star
34

plotting-tools

Jupyter Notebook
2
star
35

rubbish-geo

Python
2
star
36

blogimporter

A script that handles tedius setup tasks for the Blog section of the Wikipedia Signpost.
Python
1
star
37

data-structures-js

Implementing my way through a bunch of algos in JavaScript and Python.
Jupyter Notebook
1
star
38

coding-challenges-again

Jupyter Notebook
1
star
39

streaming-algos

Notebooks implementing a selection of streaming quantile algorithms.
Jupyter Notebook
1
star
40

nyc-transit-archive-old

An archival service for NYC transit data.
Python
1
star
41

mysite

The source code for my personal website.
HTML
1
star
42

nyc-transit-archive

Jupyter Notebook
1
star
43

quilt-sagemaker-demo

Jupyter Notebook
1
star
44

nyc-tobacco

A calculation of mean distance to tobacco stores in NYC. Based on NYC Open Data.
Jupyter Notebook
1
star
45

neural-network-notes

My notes from Geoffrey Hinton's neural networks Coursera course
Jupyter Notebook
1
star
46

rust-learn

Rust
1
star
47

nyc-gentrification-1

HTML
1
star
48

nyc-active-construction-sites

HTML
1
star
49

data-visualization-blogging

Slides from a presentation on blogging and you.
1
star
50

trash-talk

Learnings from garbage.
Jupyter Notebook
1
star
51

airflow-playground

Python
1
star
52

geoplot-images

Test images for the geoplot library
1
star
53

nyc-real-estate-sales

Data munging for a blog post on real estate concentration in New York City.
Jupyter Notebook
1
star
54

implementing-good-design

The slides from a talk I gave for the NYC D3.JS Meetup on the data visualization design process.
1
star
55

subway-explorer-webapp

How long is your commute? Proof-of-concept ground-truth MTA subway arrival time web application.
JavaScript
1
star
56

watsongraph-tutorial

Tutorial materials for the watsongraph library.
Jupyter Notebook
1
star
57

fcimporter

A script that handles tedius setup tasks for the Featured Content Report section of the Wikipedia Signpost.
Python
1
star
58

nyc-buildings

Data munging for the subject of housing value data visualization and mining projects.
Jupyter Notebook
1
star