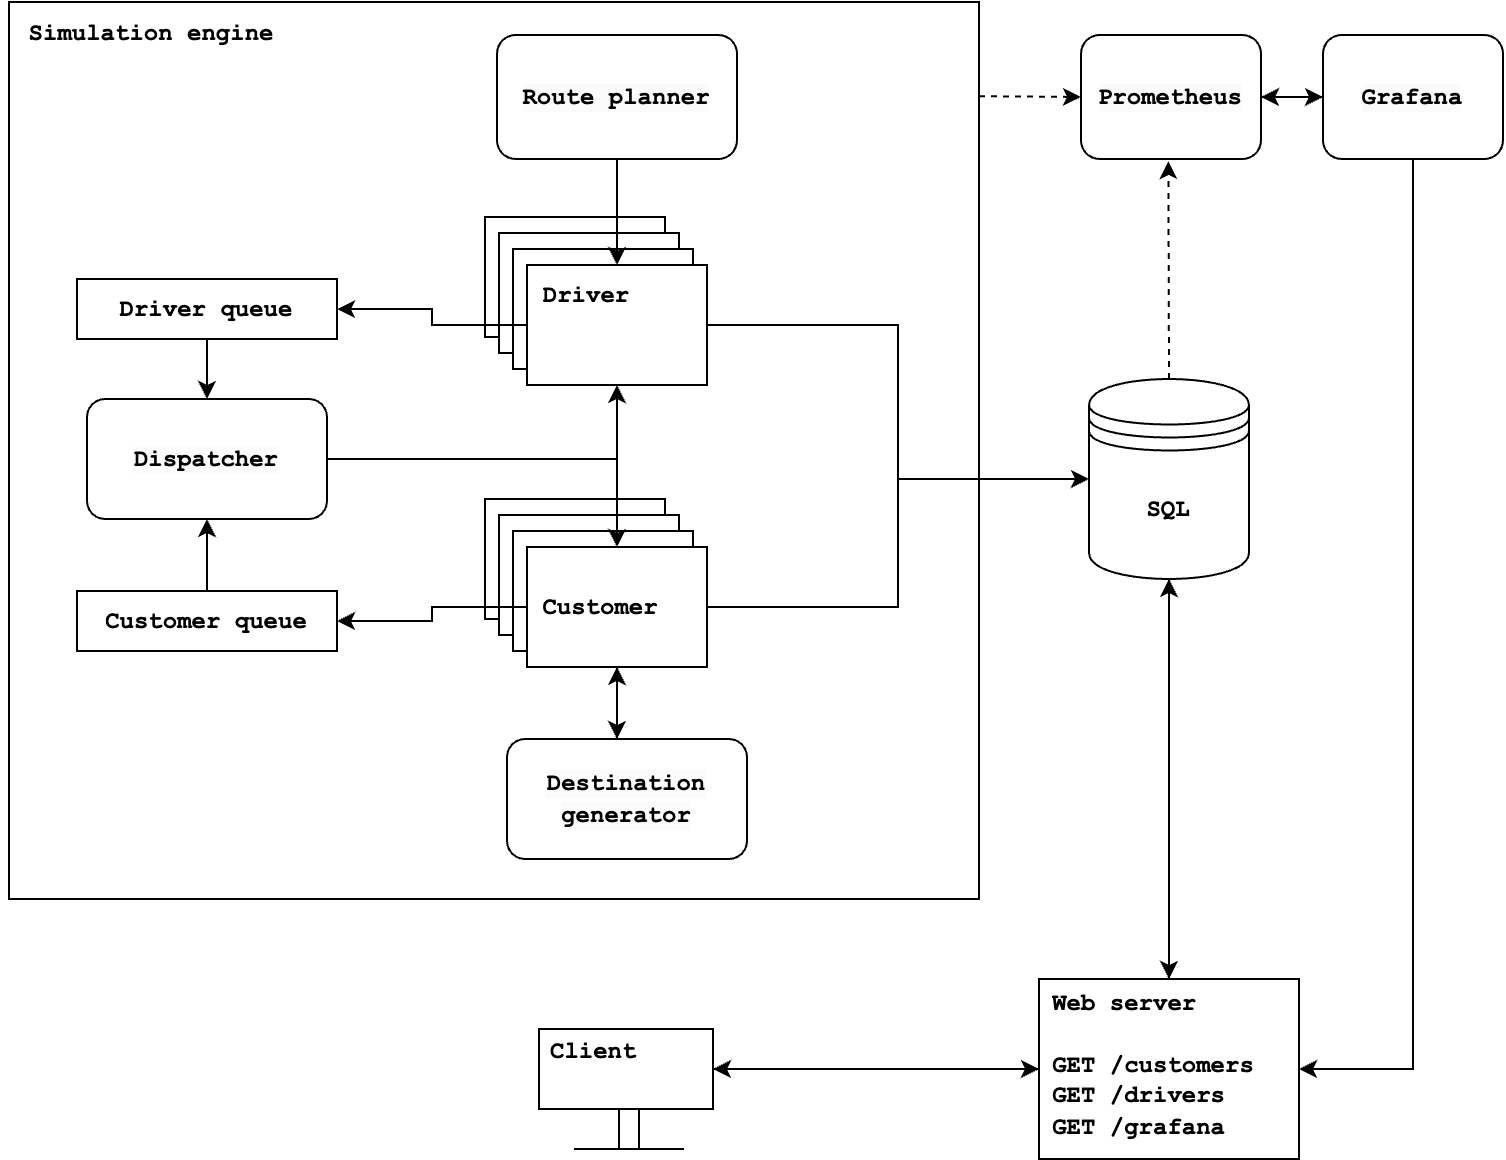
Rides simulates the basic flow of a ride-hailing app. It consists of five main components:
- The simulation engine generates the system's state and updates the database.
- The database persists the state.
- The web server exposes the state via a RESTful API to the client.
- The UI presents the real-time state of the system.
- The monitoring & logging stack provides observability of the system.
Technologies used include Node.js (simulation), Go (web server) and PostgreSQL. The frontend is written in React. All JavaScript is typed with TypeScript. Monitoring is implemented with Prometheus and Grafana. All backend components are containerized with Docker.
The system is running on a single machine with 2 GiB of memory. The distributed nature of the system is already somewhat simulated by using containers. My plan eventually is to spread it across multiple virtual servers, thus achieving a true distributed system.
Simulation engine
The key components of the simulation are the Driver and Customer instances. These instances make periodical decisions in an infinite loop. These decisions include, among others:
- Spawn and deactivation
- Request for the optimal route
- Request for a new destination
- Passenger pick-up
- Advancement of the car on the map
- Passenger drop-off
Multiple Driver and Customer instances are running simultaneously within the same process. The simulation process is lightweight - its purpose is only to run the simulation loops and update the state.
To ensure the simulation stays performant and the updates happen within the predefined interval, it is imperative that the more expensive calculations do not block the main process. Such calculations include:
- Generating destinations
- Calculating the optimal route
- Matching customers with drivers
For this reason, these calculations are running as child processes. Each of these processes maintains a queue. Customer and Driver entities request data from these services as needed and await a response. They might complete several simulation cycles before the response arrives, at which point they start acting according to the new information.
Database
The database is PostgreSQL and stores the data in customers and drivers tables:
customers: id, customer_id, name, active, location, destination, driver_id
drivers: id, driver_id, name, status, location, path, text, path_index, customer_id, customer_name
While a NoSQL database is probably more suitable for this project due to schema flexibility and better write throughput, I wanted more hands-on experience with SQL, since in my previous projects and work experience, NoSQL has been prevalent. This is a common theme in this project - I might choose a particular technology simply because I’m interested in exploring it.
Web server
The web server is written in Go. It exposes the data via a RESTful API at the /customers and /drivers endpoints and servers the frontend application. It also exposes the Grafana dashboard via a proxy.
UI
The frontend application is written in React. The frontend polls the server for updates in 1 second intervals. The map visualization is implemented from scratch. On receiving an update, it spreads the movement of the car until the next update, achieving a smooth animation in small increments.
Monitoring & logging
Monitoring & logging stack is implemented with Prometheus & Grafana. It provides observability of the system parameters such as disk space and memory, as well as container-specific metrics.
